Rents are already falling. Official data hasn't noticed
New-lease indices lead CPI rent ~12 months
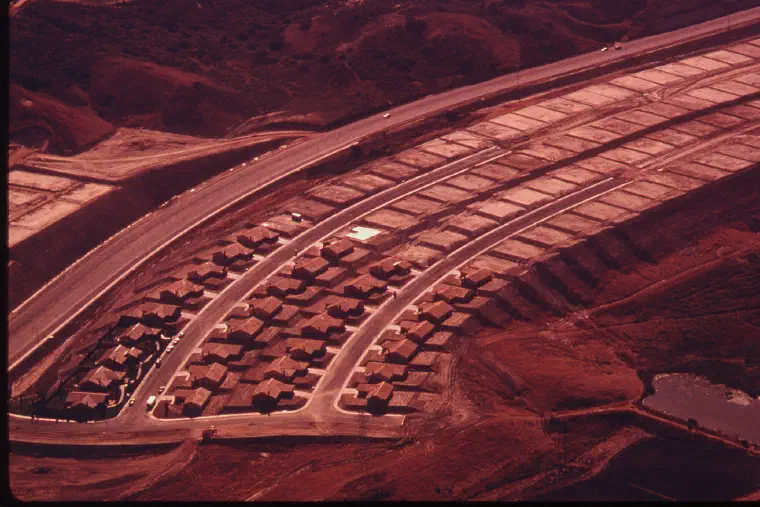
Among the many statistical anomalies embedded in the US macroeconomic dashboard, none is currently creating more analytical distortion than the housing component of the consumer price index. In the official October inflation release, the shelter index advanced by 0.8 per cent month-on-month, marking its steepest monthly climb in more than three decades. To anyone who reads only government statistical releases, the American rental market appears to be accelerating into a hyper-inflationary frenzy. To corporate real estate operators, property technology firms, and institutional landlords, this official data is an absurd historical artifact. In the real world of market-clearing leases, residential rents are already rolling over.
This massive disconnect between official statistics and prevailing market prices is not an accident; it is the direct consequence of the survey methodology employed by the Bureau of Labor Statistics. The official shelter metric does not measure spot transactions; it measures the average rent paid across the entire existing housing stock, including leases signed six, twelve, or eighteen months ago. In an environment where the residential property market has ground to an abrupt halt under the weight of seven per cent mortgage rates, relying on this backward-looking series guarantees that monetary policymakers are driving the economy by looking exclusively in the rear-view mirror.


The Leading-Indicator Pipeline
Privately compiled high-frequency rental indices—such as those published by Zillow, Apartment List, and real estate data aggregators—track spot market transactions: the actual prices at which vacant apartments are leased to new tenants. These private indices peaked in late 2021 and early 2022, when annual rent growth reached an unsustainable seventeen per cent. Since the spring of 2022, however, the trajectory has completely reversed. Spot rents have decelerated at a record pace, with sequential monthly readings turning negative across major metropolitan areas over the past two months.
Academic research and econometric modeling demonstrate that spot lease indices lead the official CPI shelter index by approximately twelve months. The mechanism is mechanical: only about eight per cent of the national tenant base signs a new lease in any given month, while the remaining ninety-two per cent continue paying under pre-existing annual contracts. It takes a full year for a shift in spot market rates to diffuse through the entire surveyed housing stock. Consequently, the ferocious shelter inflation currently being reported in government tables reflects the housing boom of autumn 2021, not the cooling reality of late 2022.

The Risk of Policy Overshoot
Because shelter accounts for thirty-four per cent of the headline consumer price index and over forty per cent of core CPI, this measurement lag poses an immense systemic hazard to monetary policy. If the Federal Open Market Committee insists on waiting for the official shelter metric to decelerate before pausing its interest rate increases, it will inevitably overtighten. By the time the government’s lagged rental surveys reflect the reality of flat-to-falling housing costs in late 2023, the central bank will have held borrowing costs in deeply restrictive territory for an entire year too long.
For corporate treasurers and debt allocators, this analytical lag creates a profound distortion in real interest rates. If one replaces the backward-looking official shelter figure with current spot rental data, underlying core inflation is already running between two and three per cent, rather than the published six per cent. This implies that current nominal interest rates of 4 per cent are already producing deeply restrictive real rates across the commercial economy.
The Federal Reserve's refusal to formally adjust its inflation targets for this known statistical lag is driving the economy toward an unforced balance-sheet contraction. Central bankers are tightening monetary conditions against the ghost of housing inflation that has already vanished from spot rental transactions, ensuring that the eventual economic deceleration will be far steeper than necessary. Investors who understand the twelve-month rent lag should prepare for an abrupt, violent rollover in headline inflation prints once the government's calendar finally catches up with market reality.